

How we calculate land potential
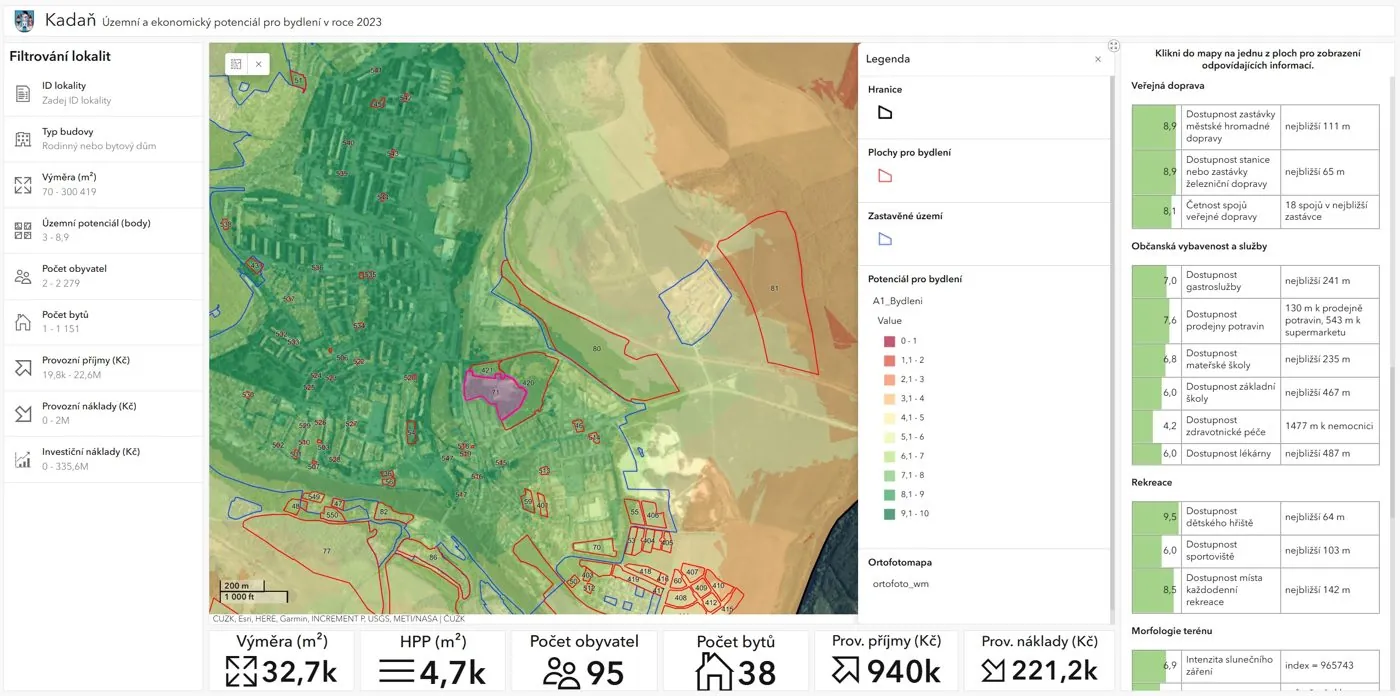
Land potential describes how well a place suits a given use, most often housing. We express it on a scale of 0 to 10 for every location in the city, not only for selected sites, and then summarise it for each development site in the land-use plan.
We look at every site through three independent questions:
- Potential: how good is this place to live in? (scale 0–10)
- Constraints: what stands in the way of building here? (scale 0–3)
- Economics: what will the site cost and what will it bring to the city budget?
The answers are kept apart until the very end. Only then do we combine them into a recommendation.
Criteria
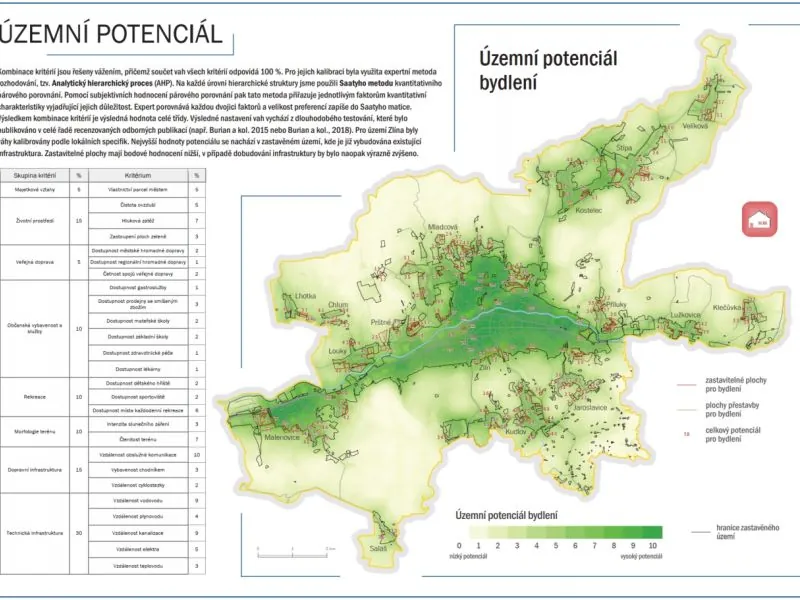
Potential is built from dozens of criteria in several groups. For housing there are usually about thirty:
- quality of the residential environment: noise, industrial and agricultural sources of pollution and odour nearby, fragmented development, and on the positive side brownfields ready for reuse,
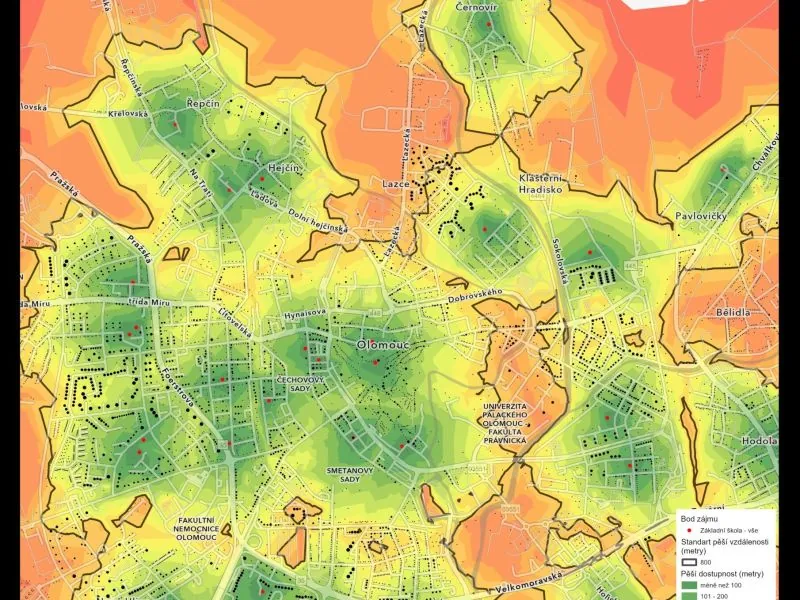
- public transport: walking distance to a stop and how often services run,
- public amenities and services: schools, nurseries, doctors, shops, sport and culture,
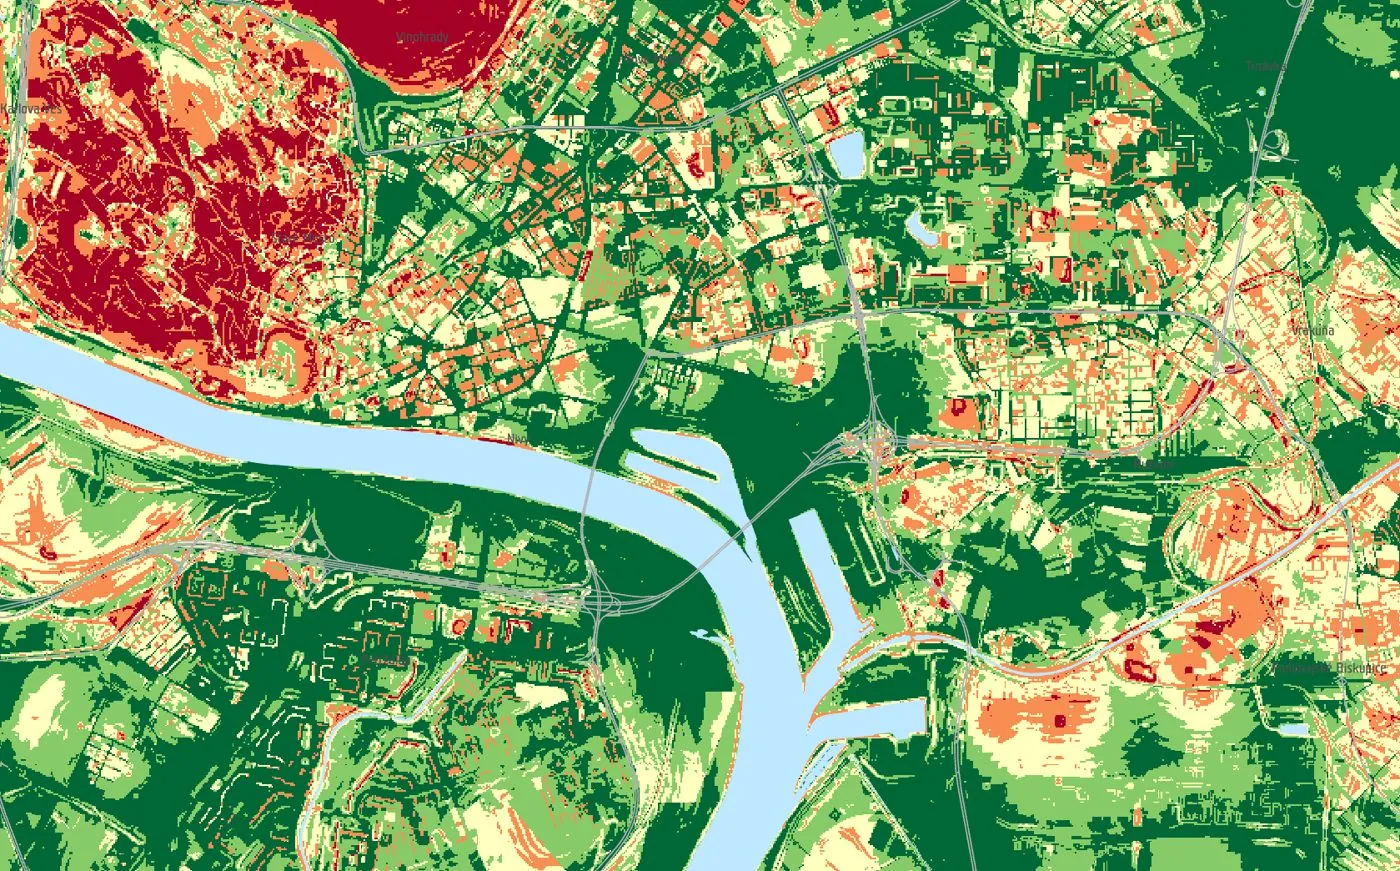
- recreation: parks, woods and water within reach,
- technical infrastructure: distance to water, sewerage, gas and electricity.
Each criterion has its own table converting a measured value into a score from 0 to 10. Accessibility is computed over the real network separately for walking, cycling, public transport and car, and each mode is weighted for the target group: people walk to a nursery but travel to a theatre. Beyond 15 minutes a service adds nothing to the potential, because people stop seeing it as theirs.
Weights
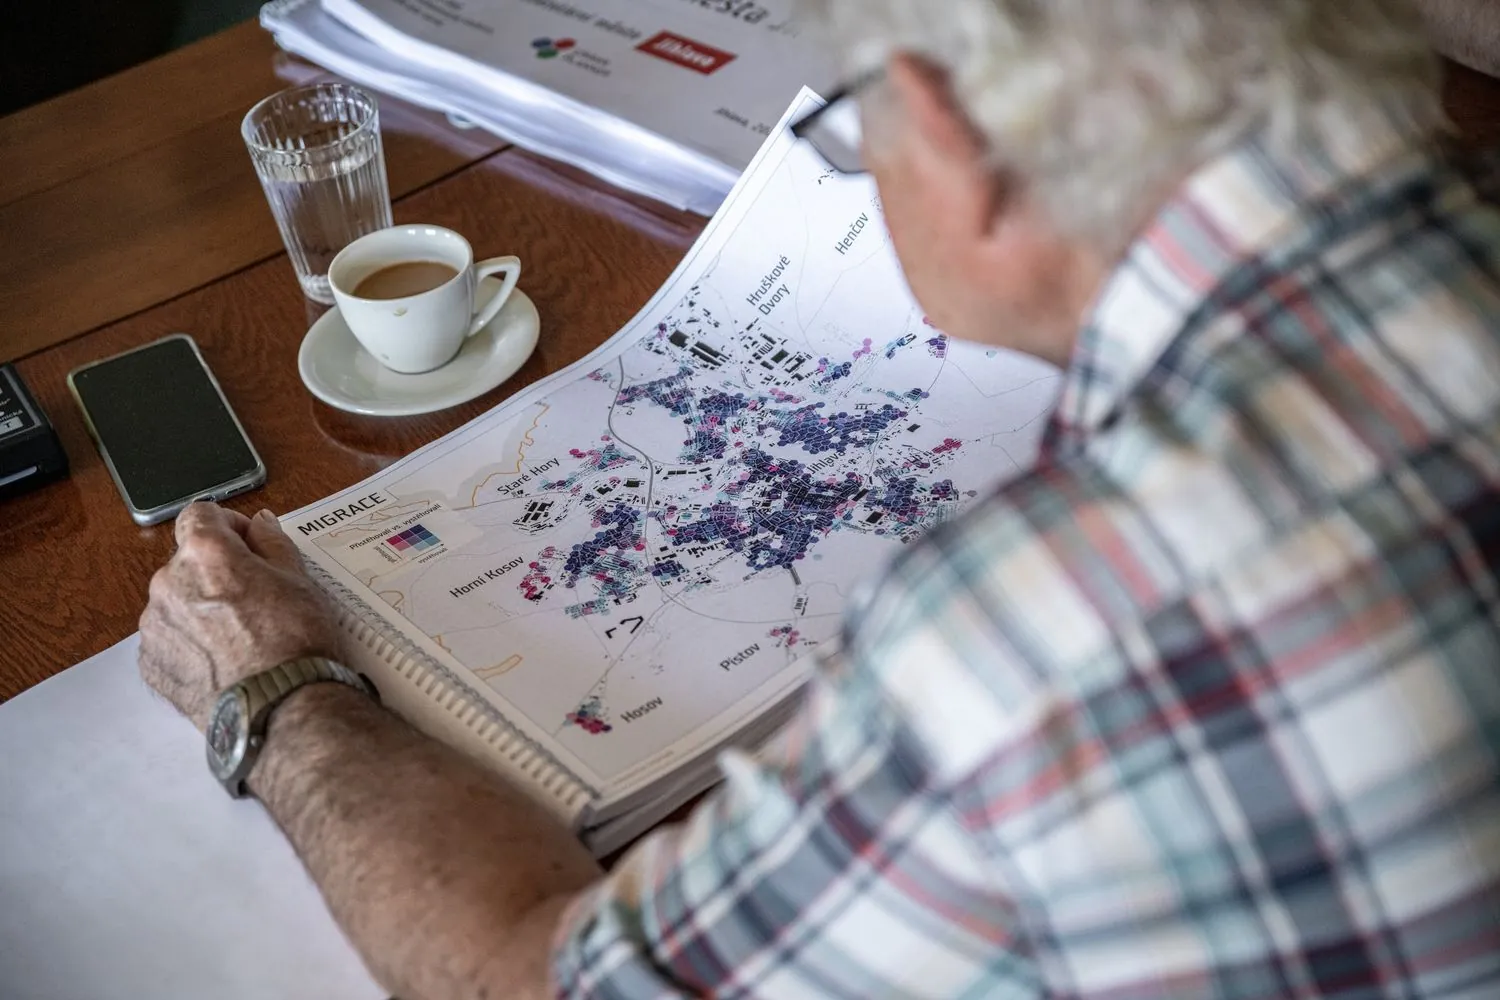
Not every criterion matters equally. The weights are not set by us but by people who know the city, usually experts from the client's own office. We use pairwise comparison (Saaty's Analytic Hierarchy Process): for every pair of criteria they say which one is more important and by how much. The weights are calculated from their answers and checked for consistency.
The weights are published in the report. When the city's priorities change or a criterion is added, we revise the weights where needed without repeating the whole survey.
The potential map
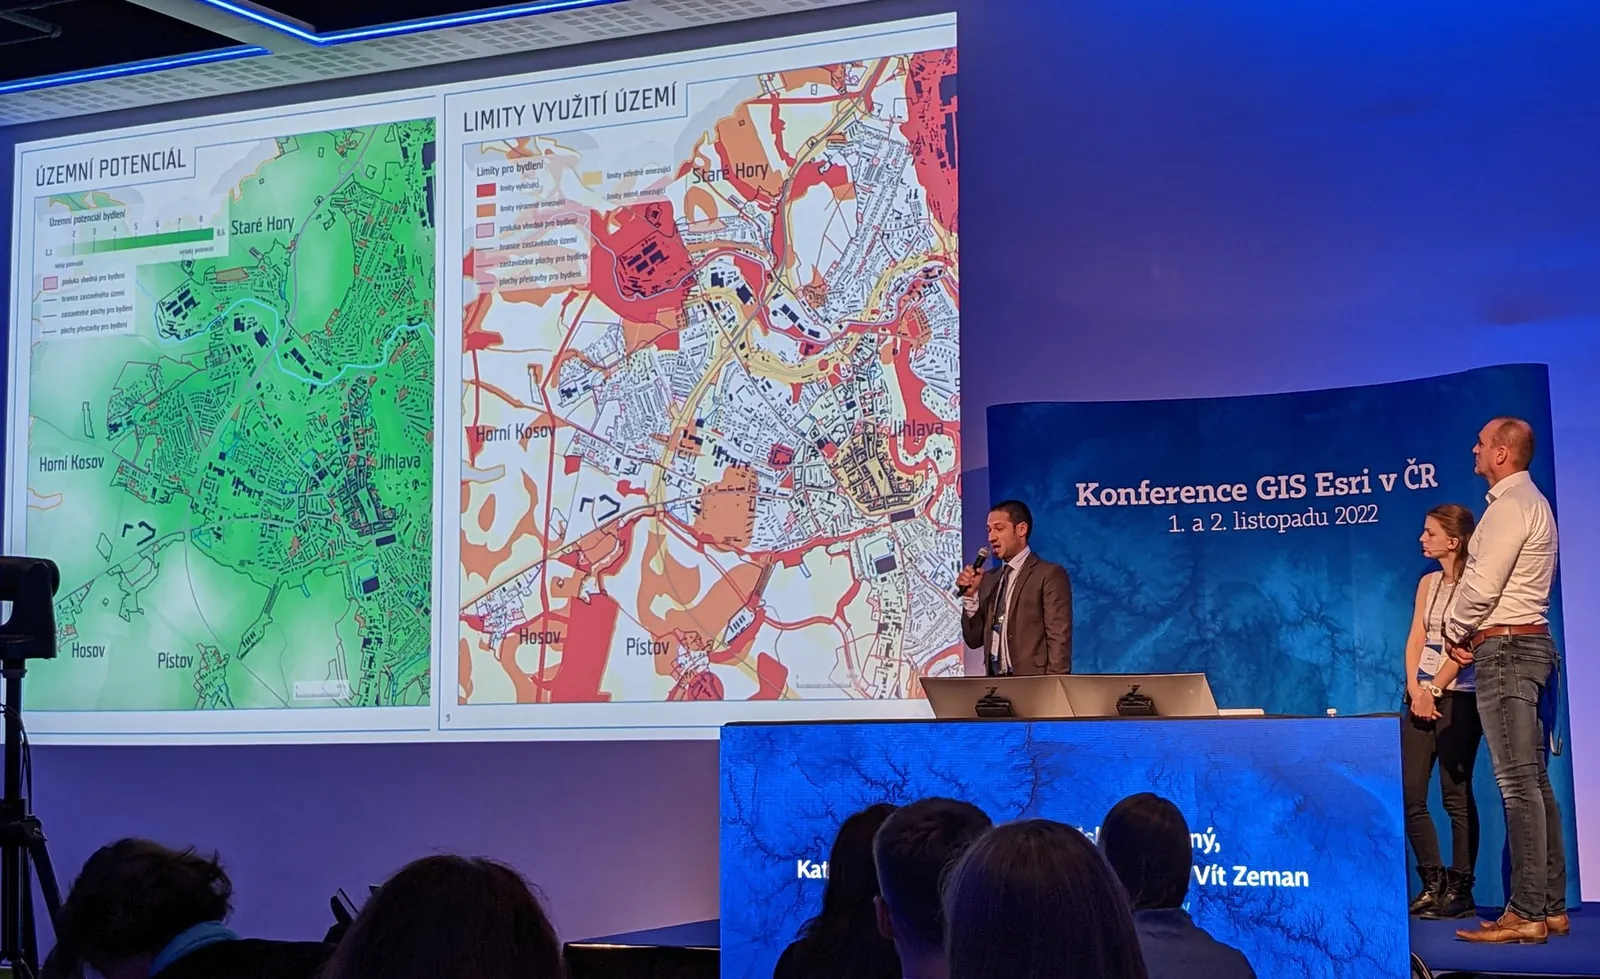
The weighted sum of the criteria gives a potential map of the whole area, from 0 (unsuitable) to 10 (excellent). The scale is absolute and has verbal bands, so a value of 7 means the same in a city we work in for the first time and in a recalculation several years later.
Constraints kept separate
Protection zones, flood areas, nature protection, steep slopes and other land-use constraints do not enter the potential. We assess them separately on a scale of 0 to 3, from no constraint to a site where building is practically ruled out. A site can therefore have high potential and strong constraints at the same time, and both remain visible. Mixing them into one number would hide why a site scored badly: whether it is a poor location or a good one in a flood zone.
Economics
The economic assessment estimates what a site will cost and what it will bring to the city budget. We do not rank sites by it. Our calculations showed that the balance depends almost entirely on the type and density of development, not on location, so a ranking by money would really rank sites by how many homes fit on them, not by the quality of the place. The cost of bringing utilities to a site is not counted twice; it is already part of the infrastructure criteria.
The result: categories, not a league table
Potential, constraints and site capacity are combined only at the end. Each site is assigned a category:
- A – the most suitable sites, with high potential and low constraints,
- B – medium potential and sufficient capacity,
- C – sites blocked by strong constraints or with small capacity,
- D – sites with low potential.
Category thresholds are tied to the verbal bands of the potential scale, and we do not shift them to make the numbers look nicer. The city gets a basis for decisions, not a ready-made ranking, and can see for every site why it ended up in its category.
Why the calculation can be trusted
- The report contains the scoring table of every criterion, the weights and the calculation steps. The result can be checked without access to our software.
- Input data are public or come from the client: planning analysis data, the land-use plan, the register of territorial identification, addresses and real estate (RÚIAN), the national topographic database, timetables and registers of pollution sources and facilities.
- The calculation runs as scripts in ArcGIS Pro, so it can be repeated with new data or different weights, and results from different years are comparable.
- The method was peer reviewed in the journal Geografie, and every client comments on it. We keep a record of the comments and how we addressed them, and keep refining the method.
Where the method comes from
The Urban Planner model was created in 2009 at the Department of Geoinformatics, Faculty of Science, Palacký University Olomouc. We described it in the peer-reviewed journal Geografie in 2015. Since 2021 we have developed it further on projects for Jihlava, Zlín, Kadaň, Bratislava, Kolín and the Brno Metropolitan Area, and since 2023 also for 17 other towns.